Why Going All-In on Nasdaq 100 Keeps Me Up at Night
[DISCLAIMER] This article is for educational and informational purposes only and does not constitute investment advice.You are solely responsible for your own investment decisions.
HaoWai(Fxcns.com) shall not be liable for any financial losses that may arise from the use of information provided on this website.
— 11 Years of Backtesting Data Reveal: Asset Allocation and Rebalancing Are the Core of Long-Term Investing
I'm Uncle Haowai, a CQF charterholder with over 10 years of experience in financial education. Recently, I've received many messages asking about the Nasdaq 100: "Should I dollar-cost average into Nasdaq 100 or go all-in at once?" "Is the Nasdaq ETF still worth buying at such a high premium?" "For a 15+ year investment horizon, should I buy exchange-traded or OTC funds?"
Honestly, behind all these questions lies a more fundamental misconception—
Many people equate "holding Nasdaq 100 long-term" with "guaranteed easy money."
Today, I'll use 11 years of real backtesting data to help you see the truth: behind the high returns of a single asset lies risk you may not be able to stomach. Asset allocation and rebalancing are what enable ordinary investors to stay the course for the long haul.
I. Let's Look at the Numbers: How Much Can You Make Going All-In on Nasdaq 100 for 11 Years?
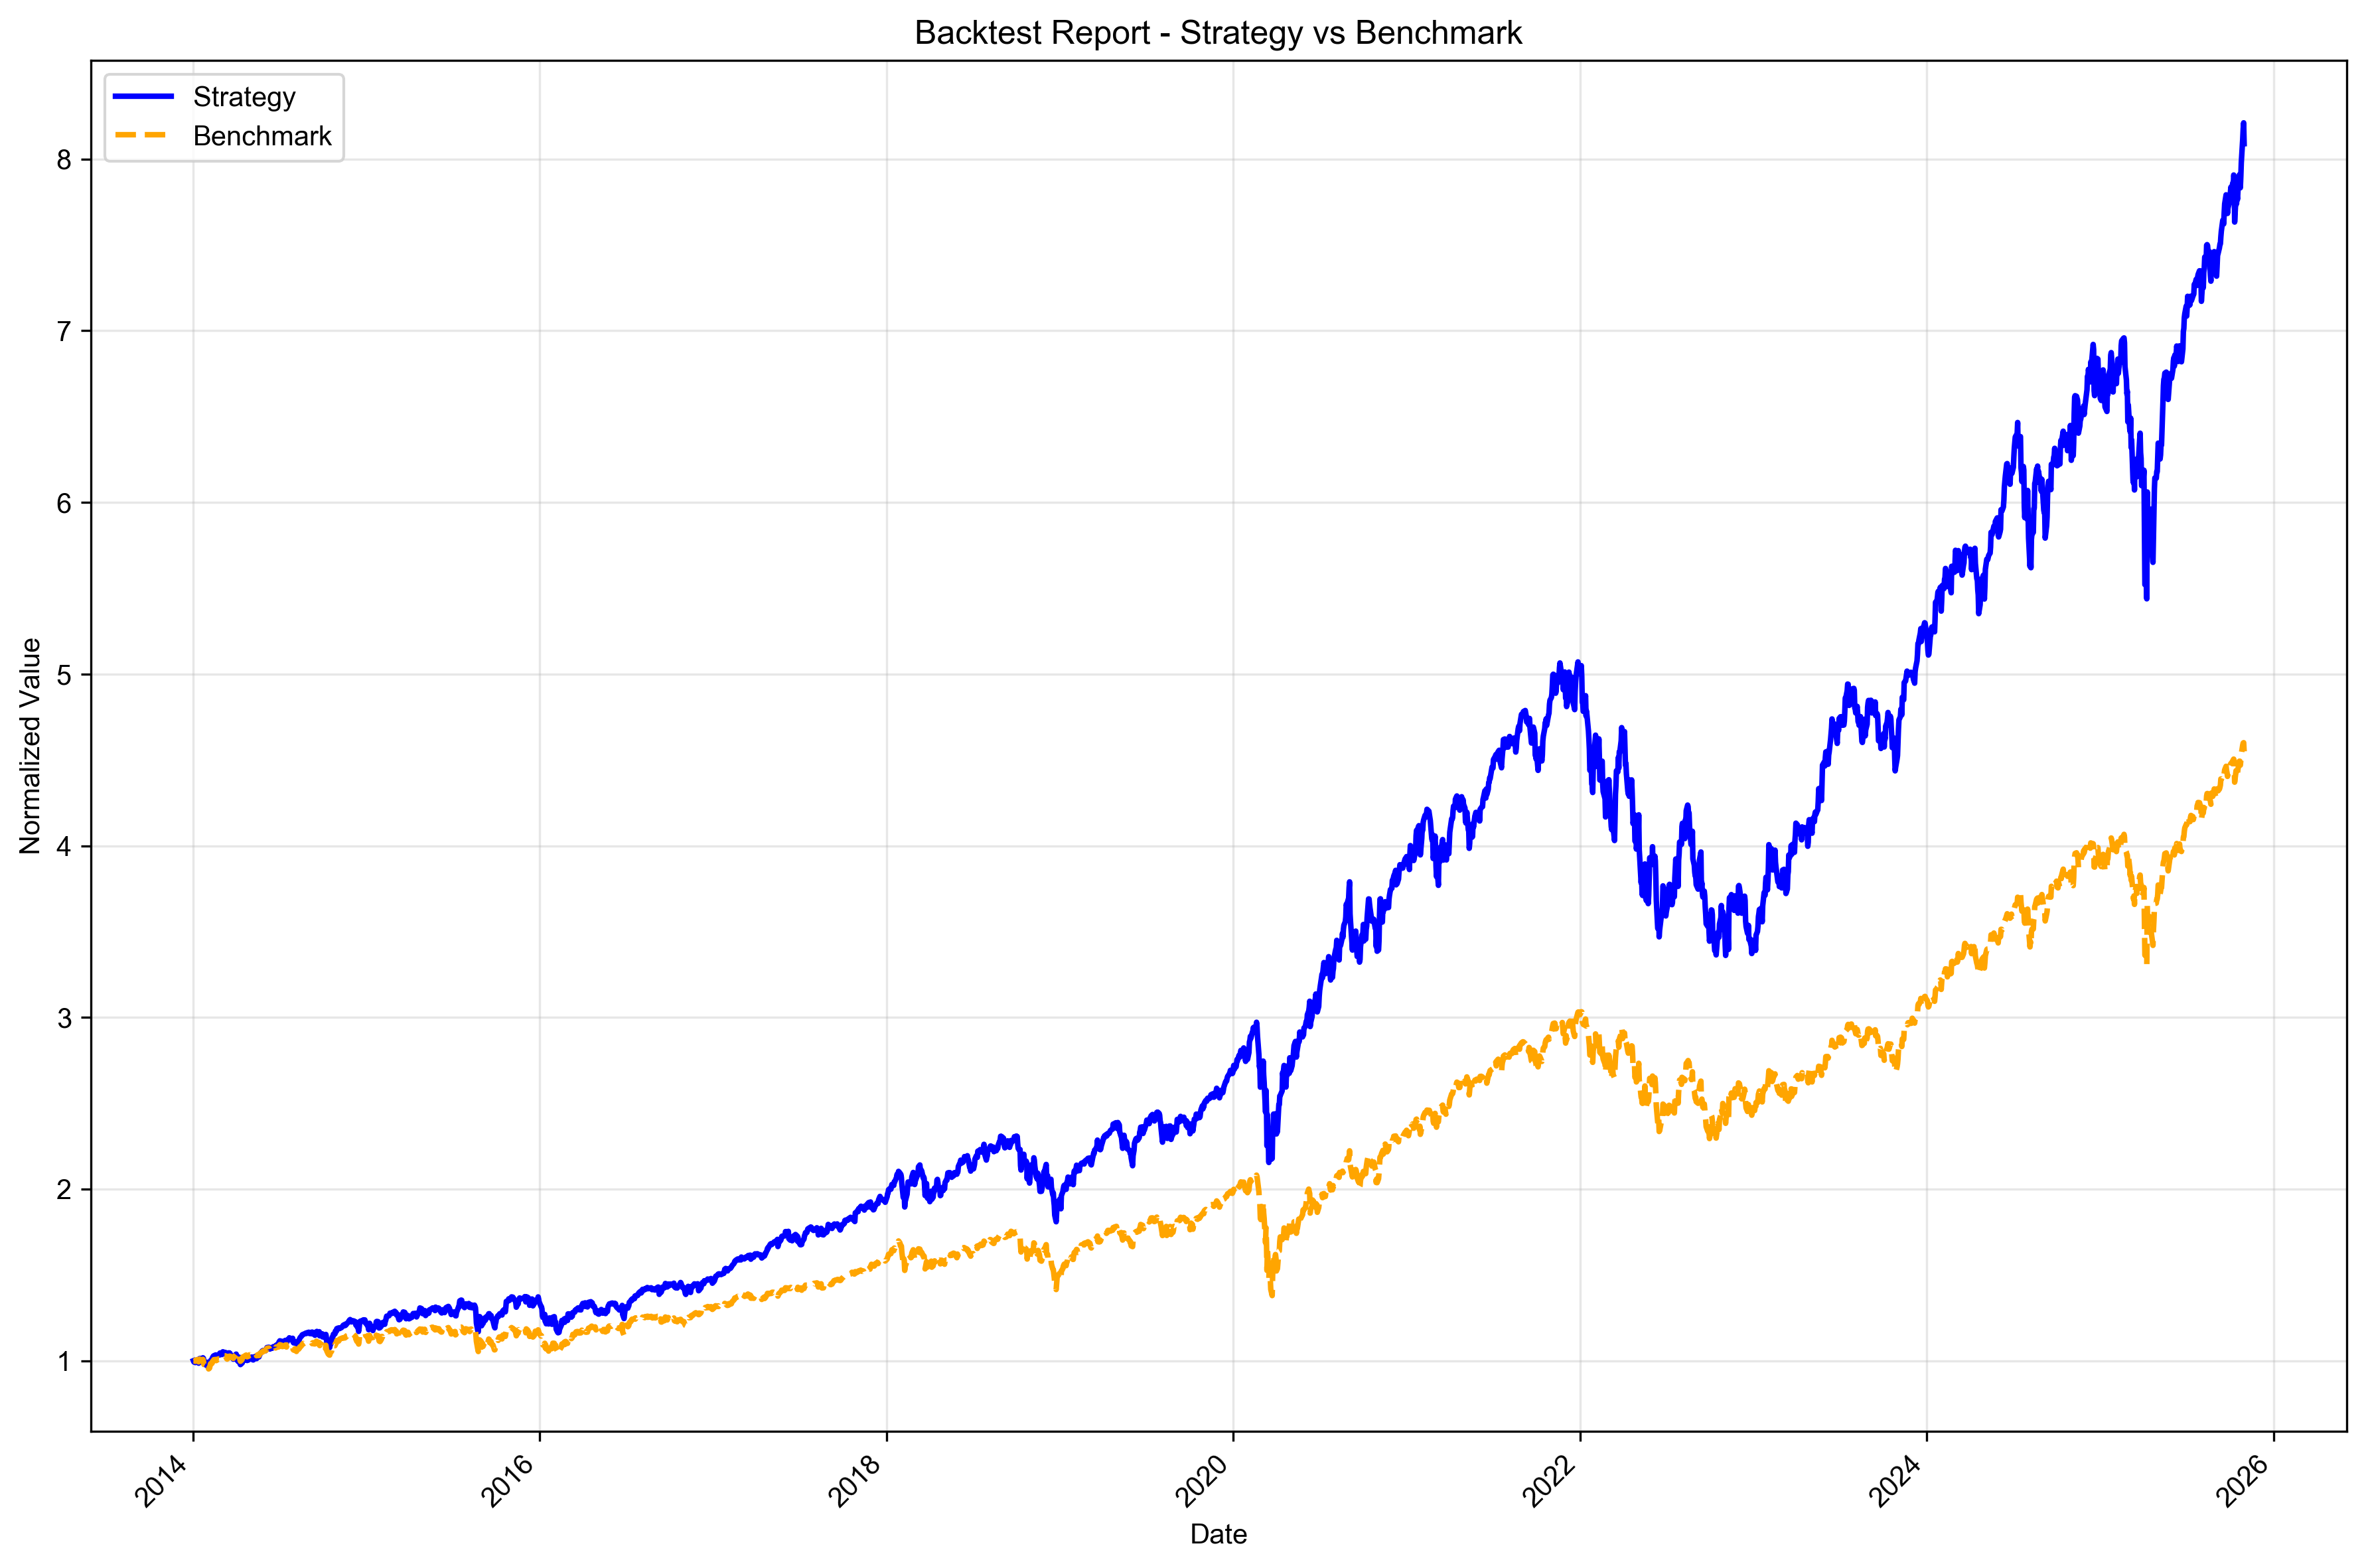
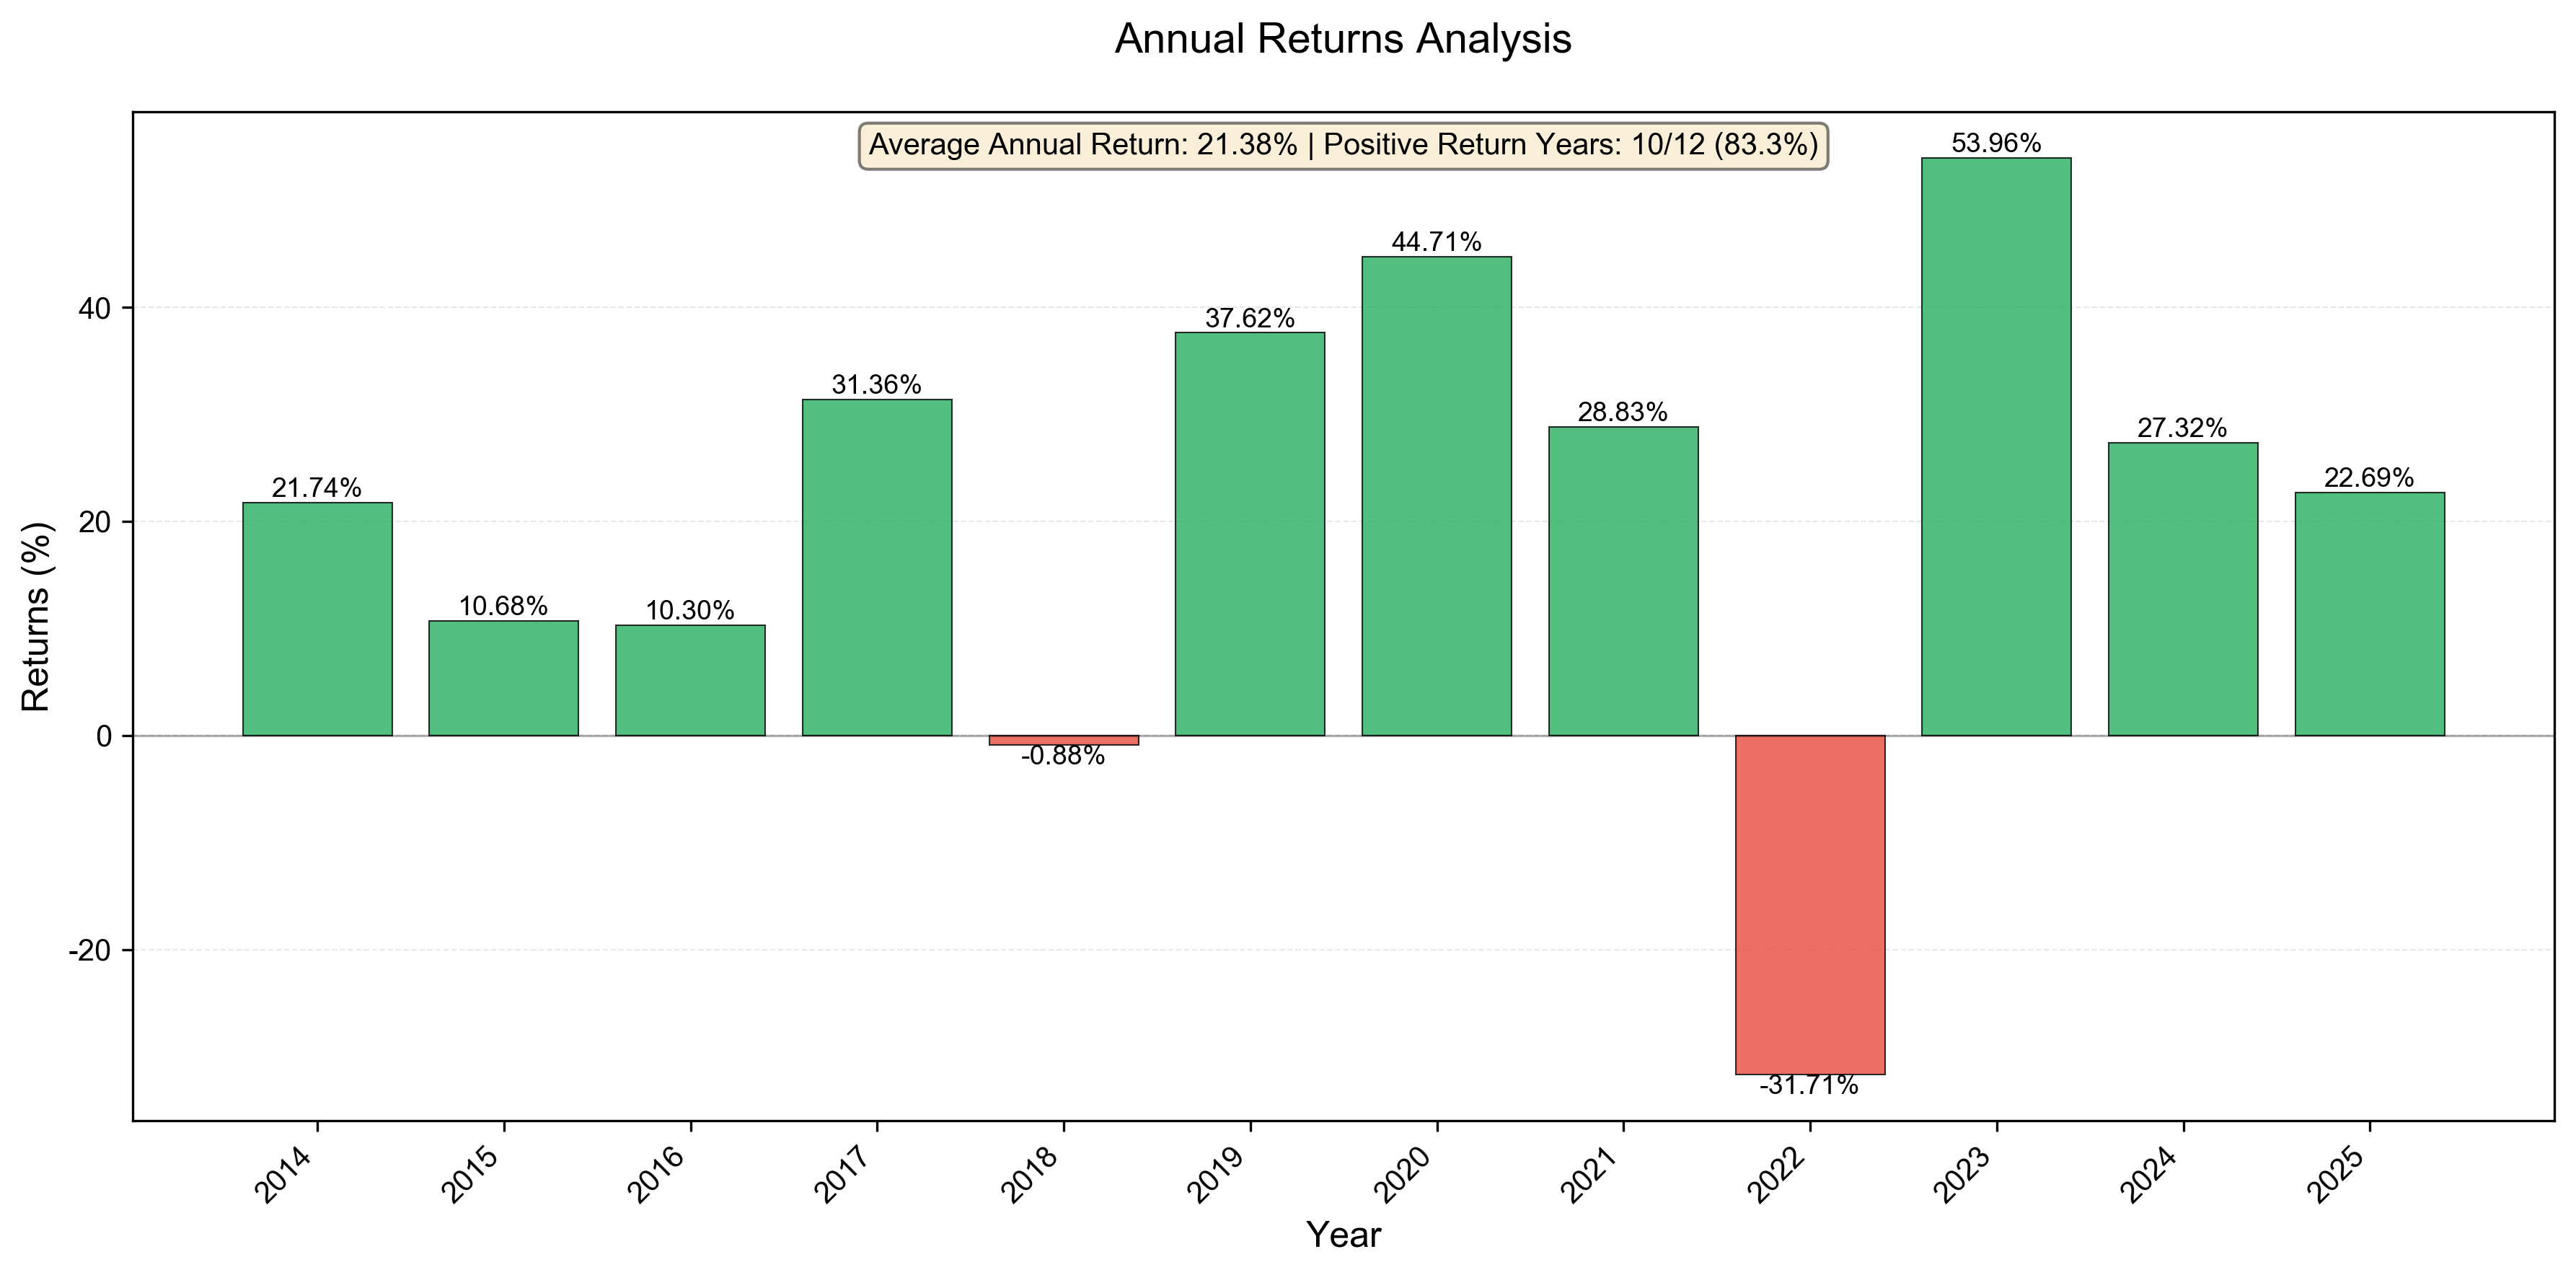
I ran a backtest using data from January 2014 to October 2025, assuming an initial investment of $1 million, 100% allocated to Nasdaq 100 (represented by QQQ), with no adjustments. Here's what 11.8 years looks like.
The results are certainly tempting:
| Metric | Value |
|---|---|
| Final Portfolio Value | $8.088 million |
| Total Return | 708.84% |
| Annualized Return | 19.36% |
| Outperformance vs. Benchmark (SPY) | 5.68 percentage points annually |
An annualized return of 19.36%, turning $1 million into over $8 million—pretty attractive, right?
But here's the question: Could you really hold on for those 11 years?
II. Three Life-or-Death Tests Behind the High Returns
The Nasdaq 100 has experienced three unforgettable major drawdowns in its history. Each one was an extreme test of investors' psychological resilience.
2.1 The 2000 Dot-Com Bubble: The Harshest Winter
- Maximum Drawdown: -82.96%
- Recovery Time: 15.4 years
Imagine this: you invest $5 million, watch it shrink to less than $1 million, then wait 15 agonizing years just to break even. During those 15 years, you get married, have children, buy a house, change jobs... while your investment account stays in the red.
2.2 The 2008 Financial Crisis: A Test of Maturity
- Maximum Drawdown: -49.29%
- Recovery Time: 3.4 years
Having survived the 2000 bubble, tech companies had become more resilient—yet they still got cut in half.
2.3 The 2020 Pandemic: A Flash Crash
- Maximum Drawdown: -28.56%
- Recovery Time: 3.5 months
The pandemic shock came fast and left fast, but who could have predicted a rebound just 3 months later?
In my 11-year backtest, the maximum drawdown was -33.72%, and the longest drawdown lasted 714 days—nearly two years.
A volatility of 20.64% means your account could swing up or down by 20% at any time. $1 million today could become $800,000 tomorrow.
Can you really hold on when your account is down by a third?
III. A Different Approach: Trading Returns for Peace of Mind
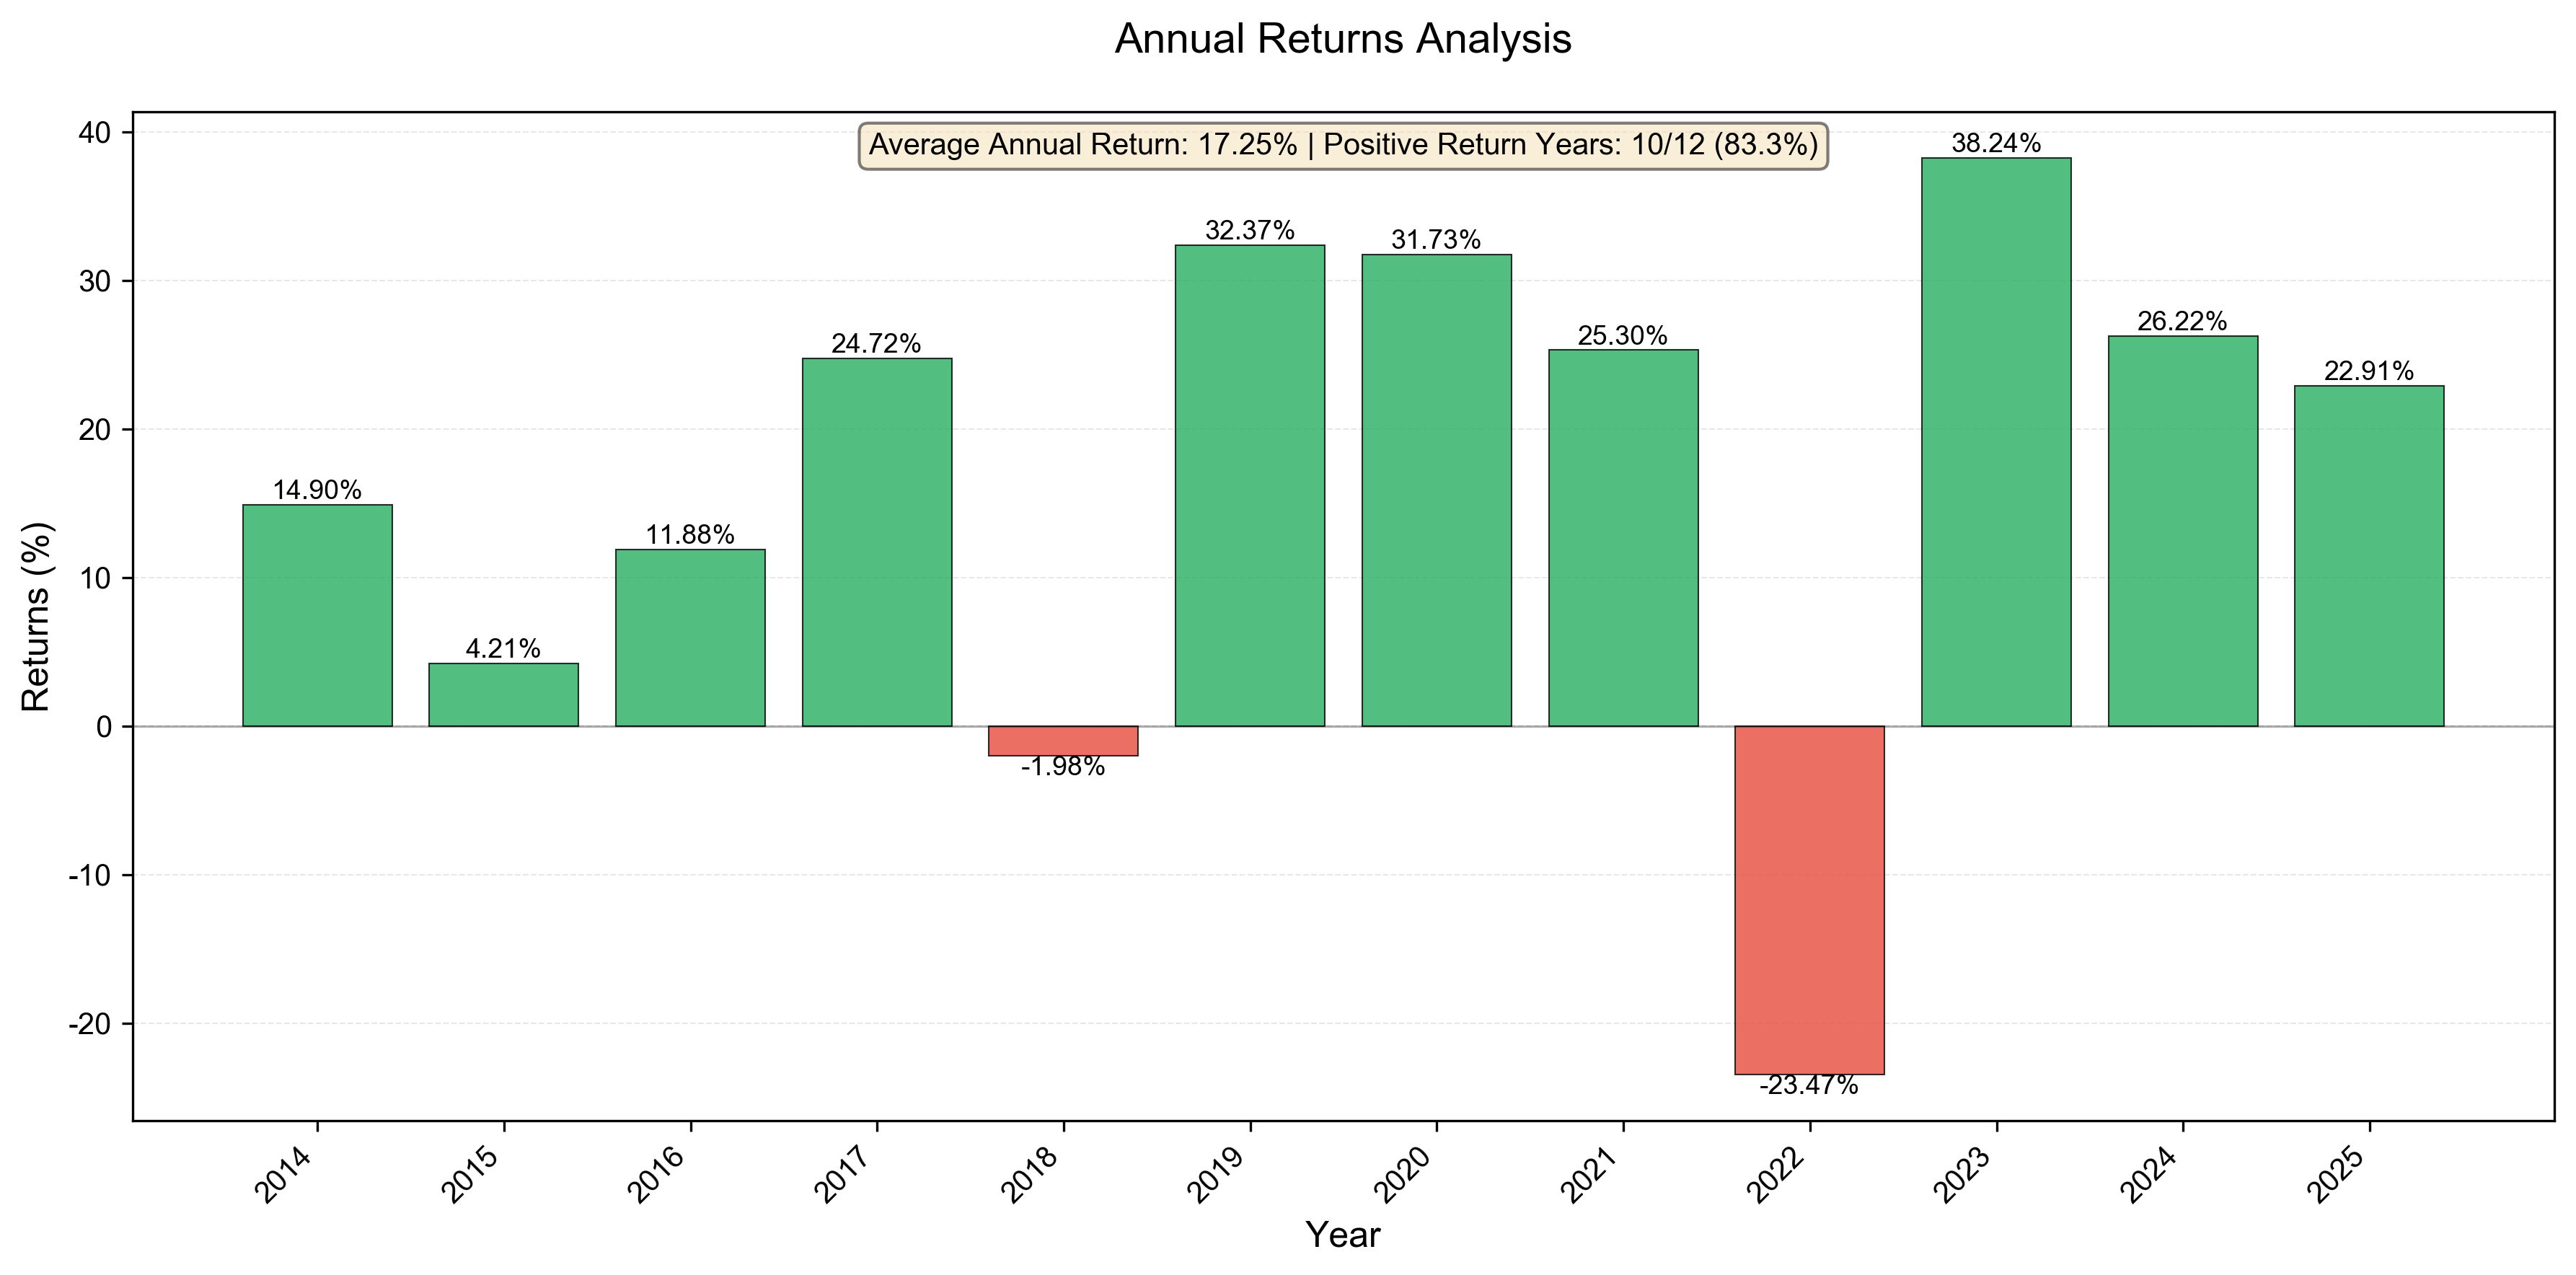
I ran another comparative experiment: instead of 100% Nasdaq 100, I used a three-asset portfolio—
- Nasdaq 100: 40%
- Asset A (a broad market index with some correlation to Nasdaq): 40%
- Asset B (a safe-haven asset negatively correlated with equities): 20%
Same starting point, same 11 years. Let's see what's different.
3.1 Core Metrics Comparison
| Metric | 100% Nasdaq 100 | Three-Asset Portfolio (Rebalanced) |
|---|---|---|
| Final Portfolio Value | $8.088 million | $6.383 million |
| Total Return | 708.84% | 538.26% |
| Annualized Return | 19.36% | 16.99% |
| Maximum Drawdown | -33.72% | -25.72% |
| Volatility | 20.64% | 15.61% |
| Maximum Drawdown Duration | 714 days | 109 days |
This table reveals several key insights:
Returns did decrease, but the drop was limited. Annualized returns fell from 19.36% to 16.99%—a difference of 2.37 percentage points. Over 11 years, final value dropped from $8.08 million to $6.38 million—$1.7 million less.
But risk dropped significantly. Maximum drawdown fell from -33.72% to -25.72%—8 percentage points less pain. Volatility dropped from 20.64% to 15.61%—account swings reduced by nearly a quarter.
The most critical number: maximum drawdown duration dropped from 714 days to 109 days.
From nearly 2 years of agony to just over 3 months of waiting. What does this mean? It means you don't have to spend endless months doubting yourself and fighting the urge to panic sell.
3.2 Risk-Adjusted Returns
Measuring investment performance isn't just about returns—you also need to consider how much risk you're taking. Here are two key metrics.
The Sharpe Ratio is the most commonly used risk-adjusted return metric. It uses total volatility to measure risk, telling you: for every unit of volatility you bear, how much excess return do you get?
But the Sharpe Ratio has a problem: it treats both upside and downside movements as "risk." In reality, ordinary investors only worry about losses—no one complains when their account goes up too much.
That's why there's another metric that better reflects investor psychology—the Sortino Ratio.
The Sortino Ratio only calculates "downside volatility"—it focuses solely on the volatility of losses, ignoring upside movements. This better matches our true feelings: making money isn't risk; losing money is.
| Strategy | Sharpe Ratio | Sortino Ratio | Downside Deviation |
|---|---|---|---|
| 100% Nasdaq 100 | 0.7930 | 0.8769 | 22.09% |
| Three-Asset Portfolio (Rebalanced) | 0.8964 | 1.0261 | 16.56% |
From this table, we can see:
- Sharpe Ratio: The three-asset portfolio's 0.8964 is 13% higher than the all-Nasdaq's 0.7930
- Sortino Ratio: The three-asset portfolio's 1.0261 is 17% higher than the all-Nasdaq's 0.8769
The larger gap in Sortino Ratio tells us something important:
The three-asset portfolio does a much better job of controlling downside risk. Its downside deviation dropped from 22.09% to 16.56%—a reduction of nearly a quarter.
In other words: the three-asset portfolio not only delivers better "bang for your buck" in returns, but also performs more steadily when you're hurting most (during drawdowns).
IV. Rebalancing: Making Asset Allocation Actually Work
Some might ask: can't I just set up the allocation and leave it alone?
I tested this too. Same three-asset portfolio—one rebalanced quarterly, the other left untouched.
| Metric | Three-Asset (No Rebalancing) | Three-Asset (Quarterly Rebalancing) |
|---|---|---|
| Final Portfolio Value | $5.880 million | $6.383 million |
| Annualized Return | 16.18% | 16.99% |
| Maximum Drawdown | -27.36% | -25.72% |
| Volatility | 16.33% | 15.61% |
| Sharpe Ratio | 0.8075 | 0.8964 |
| Maximum Drawdown Duration | 693 days | 109 days |
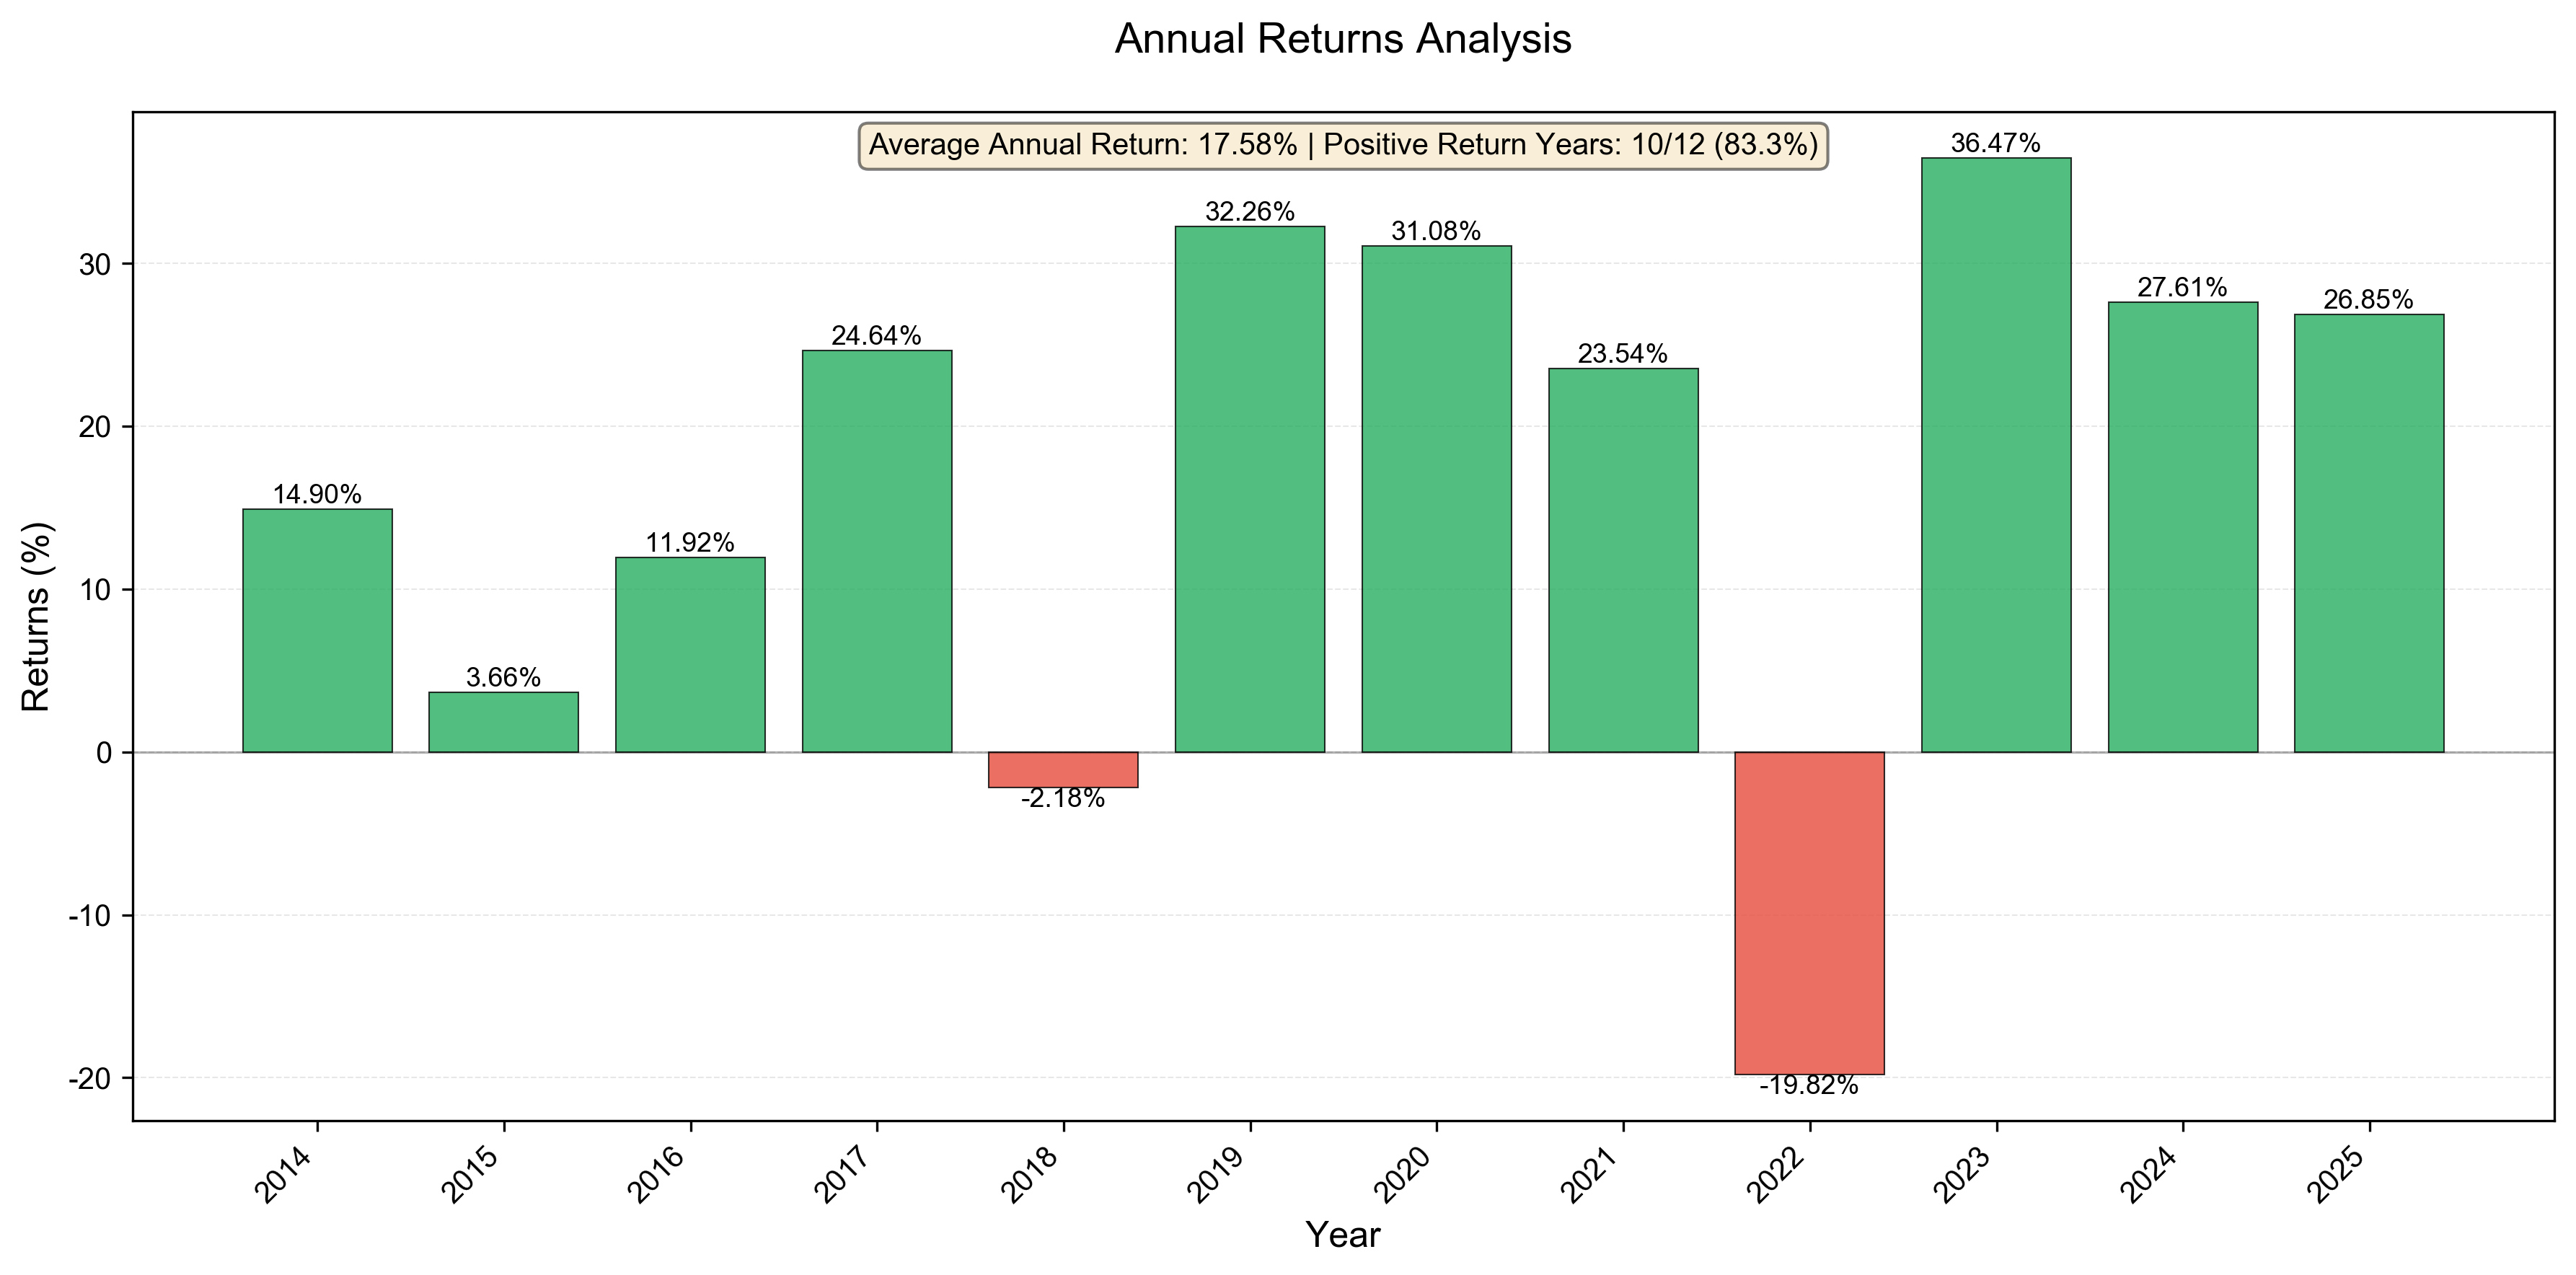
The difference is clear:
- Returns: Rebalancing earned an extra $500,000, with annualized returns 0.81 percentage points higher
- Risk: Maximum drawdown was 1.64 percentage points less, volatility was 0.72 percentage points lower
- Drawdown Recovery: From 693 days down to 109 days—a difference of nearly 600 days!
Why does rebalancing work?
The core logic is simple: it forces you to "sell high, buy low."
When Nasdaq rises and exceeds 40% of your portfolio, rebalancing sells some Nasdaq and buys the relatively cheaper assets. When Nasdaq falls below 40%, rebalancing adds more Nasdaq.
This sounds simple, but 99% of people can't do it—because human nature is to chase winners and dump losers. The rebalancing mechanism uses discipline to overcome human nature.
V. Is This Strategy Right for You?
Honestly, there's no one-size-fits-all answer.
If you meet the following criteria, going all-in on Nasdaq might actually suit you:
- Your investment horizon is truly long (15+ years), and you won't need this money in between
- You have exceptional psychological resilience and can sleep soundly even when your account is down 50%
- You have deep knowledge of the tech industry and can assess long-term trends
- Losing this money entirely wouldn't affect your life
But if you're an ordinary working professional, investing to improve your life rather than stress over it, then multi-asset allocation + periodic rebalancing might be the more practical choice.
It sacrifices some returns (2-3 percentage points annually), but in exchange you get:
- A smoother holding experience
- Shorter periods of waiting through losses
- A higher probability of staying the course
What's the biggest risk in investing? It's not picking the wrong asset—it's exiting at the wrong time.
A strategy you can stick with is a good strategy.
Final Thoughts
Today we used real data to dissect a core question: why shouldn't ordinary investors put all their assets into Nasdaq 100?
It's not because Nasdaq is bad—quite the opposite, its long-term performance is excellent. But precisely because it's so volatile, ordinary people struggle to hold on during drawdowns.
Asset allocation and rebalancing are essentially a "compromise with human nature." They trade some returns for the possibility that you can actually stay the course.
You might still be wondering: how exactly should I allocate? What assets work well for hedging? What are the specific steps for rebalancing?
We'll cover these questions in detail in the next article.
Follow Uncle Haowai—Making Personal Finance Simple.