Why Nasdaq-100 Beat 90% of Funds: 1583% Returns Over 27 Years
[DISCLAIMER] This article is for educational and informational purposes only and does not constitute investment advice.You are solely responsible for your own investment decisions.
HaoWai(Fxcns.com) shall not be liable for any financial losses that may arise from the use of information provided on this website.
If you had invested $1 million in the Nasdaq-100 in 1999, enduring the tech crash of 2000 (-82.96% drawdown), the 2008 financial crisis (-49.29%), and the 2020 pandemic plunge (-28.56%), how much would you have by the end of 2025?
The answer: $16,832,632.79. (This data is based on real historical backtesting from March 10, 1999, to December 31, 2025, using Python and accounting for real trading costs including commissions, slippage, and market impact, to replicate actual returns as closely as possible.)
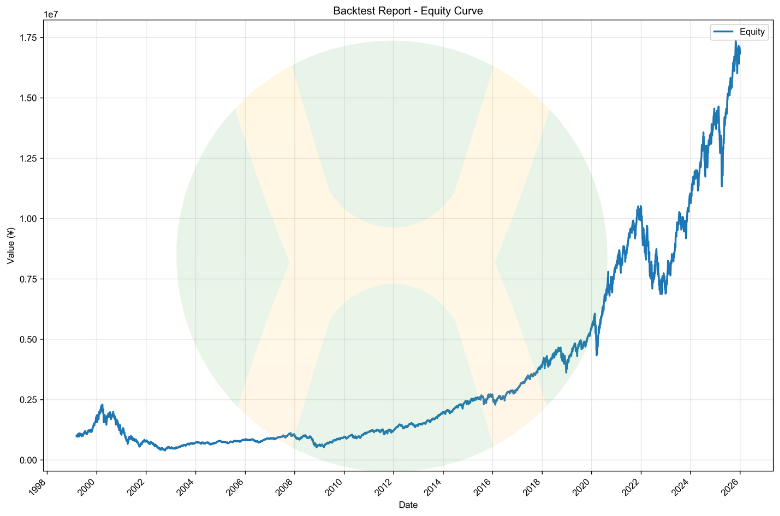
Over 27 years, that's a 1583.26% total return and an 11.12% annualized compound return. This performance beats 90% of actively managed funds and surpasses the vast majority of so-called "investment experts."
I'm Uncle Haowai, a practitioner who has been deeply involved in quantitative trading for many years. Today, I'll use 27 years of real backtesting data from 1999-2025 to completely dissect the five core mechanisms of the Nasdaq-100, revealing the underlying logic of how this "passive index" defeats "active intelligence."
I. Stock Selection Mechanism: How Five Iron Rules Lock in the Top 100 Companies
Many investors simply believe that the Nasdaq-100 is "the 100 largest non-financial companies listed on Nasdaq by market cap." This understanding is only half right, and could cause you to miss crucial investment logic.
1.1 The Five-Layer Filtering System for Stock Selection
The Nasdaq-100's stock selection rules are far more complex than imagined, requiring simultaneous satisfaction of five hard standards:
Standard One: Listing Venue Restriction
- Must be listed on the Nasdaq Global Select Market or Global Market
- Excludes over-the-counter (OTC) stocks
- This means: No matter how large the market cap, companies not listed on Nasdaq cannot be included
Standard Two: Industry Exclusion Rules
- Explicitly excludes financial companies (banks, insurance, investment firms)
- Purpose: Maintain the index's tech innovation character
- Real impact: Even though JPMorgan Chase has enormous market cap, it will never enter the Nasdaq-100
- This rule saved investors' lives during the 2008 financial crisis
Standard Three: Liquidity Threshold
- Average daily trading volume must reach at least 200,000 shares
- Three-month continuous review period
- This ensures: Each component stock has sufficient market depth, preventing violent swings when QQQ rebalances
Standard Four: Listing Duration Requirements
- Must satisfy certain trading history after IPO
- Initial inclusion typically requires one full quarter
- Special cases: Large IPOs (like Meta's listing) may be included faster
Standard Five: Dynamic Market Cap Ranking Screening
- Initial inclusion: Must rank within the top 100 by market cap
- Maintenance standard: Can tolerate ranking decline to 110th
- Removal trigger: Falling below 120th guarantees exclusion
This "buffer zone" design is ingenious, avoiding transaction costs from frequent entry and exit of component stocks.
1.2 The "Self-Correction" Capability of the Selection Mechanism
The most exquisite aspect of these rules is: it's an automated survival-of-the-fittest system.
Removed Losers (2015-2025)
- Yahoo (2017) → Acquired by Verizon, business declined, stock price nearly zero 5 years after removal
- eBay (2020) → Crushed by Amazon, market cap fell below top 120
- Baidu (2021) → Plunged during Chinese ADR regulatory turmoil, continued falling after removal
- Statistical data: Average performance of removed companies over subsequent 5 years: -35%
Newly Included Winners (2015-2025)
- Tesla (returned 2019) → Rose from $45 then to $250 in 2024 (+456%)
- Zoom (2020) → Pandemic beneficiary, despite later correction still brought investors considerable returns
- Airbnb (2021) → Travel recovery beneficiary, market cap grew steadily
- Statistical data: Average first-year performance after inclusion: +18%, 5-year average: +85%
1.3 Real Case Study: Tesla's "In and Out" Revelation
First Inclusion in 2013
- Market cap ranking entered top 100, Model S selling well
Brief Removal in 2014
- Market cap ranking fell below 120, triggering automatic removal
- QQQ forced to sell all Tesla shares
Re-Inclusion in 2019
- Model 3 sales exploded, market cap returned to top 100
- Became a component stock again
2020-2025
- Market cap surged into top 10, weight reaching 4-5%
- Became an important pillar of Nasdaq-100
This case tells us: The Nasdaq-100 isn't "once selected, lifetime guaranteed," but rather a dynamic adjustment, survival-of-the-fittest ecosystem. This mechanism ensures the index always holds the highest quality companies.
II. Rebalancing Mechanism: The Wisdom and Cost of Triple Mechanisms
Understanding selection rules, what's more critical is mastering the rebalancing mechanism—this directly affects QQQ's buying and selling timing and costs.
2.1 Triple Rebalancing Mechanisms: From Routine to Special
Mechanism One: Quarterly Routine Rebalancing
- Timing: Third Friday of March, June, September, December each year
- Content: Check component stock eligibility, fine-tune weights
- Impact: Trading volume increases 20-30%, removed stocks typically drop 2-3%
Mechanism Two: Annual Reconstitution (December Special Review)
- More thorough component stock review
- May adjust multiple stocks simultaneously
- Historical data: Average adjustment of 3-5 stocks per year
- Newly included companies average +18% gain in inclusion year (inclusion effect)
- Removed companies average -12% decline
Mechanism Three: Special Rebalancing (Most Overlooked but Most Impactful)
Trigger Conditions (meeting any one triggers rebalancing):
- Single stock weight exceeds 24%
- Top 5 stocks' total weight exceeds 48%
Adjustment Target:
- Reduce top 5 stocks' total weight below 40%
- Redistribute weight to other component stocks
2.2 2023-2024 Real Case: Chain Special Rebalancing Triggered by Nvidia
July 2023: First Trigger
Market Background:
- ChatGPT exploded, AI concept broadly erupted
- Nvidia stock price rose from $150 to $400 (+167%)
- Market cap soared from $360 billion to $1 trillion
Weight Changes:
Before Adjustment (June 2023):
- Microsoft: 12.8%
- Apple: 12.2%
- Nvidia: 7.8%
- Amazon: 6.5%
- Google A+C: 10.9%
- Top 5 total: 50.2% ← Exceeded 48% threshold
After Adjustment (July 2023):
- Microsoft: 10.5% (-2.3%)
- Apple: 10.0% (-2.2%)
- Nvidia: 6.2% (-1.6%)
- Amazon: 5.5% (-1.0%)
- Google A+C: 9.3% (-1.6%)
- Top 5 total: 41.5% ← Returned to safe zone
Cost: QQQ reduced Seven Tech Giants positions by about 8-10% at high prices. Over the next three months, these stocks continued rising 25%, opportunity cost about 2-3%.
2024: Three Consecutive Triggers
| Time Point | Top 5 Weight | Nvidia Weight | Trigger Status | Market Environment |
|---|---|---|---|---|
| Jan 2024 | 43.2% | 6.5% | Normal | AI heat continues |
| Mar 2024 | 48.8% | 8.2% | Triggered | Nvidia breaks through again |
| Jun 2024 | 44.1% | 7.1% | After adjustment | - |
| Sep 2024 | 49.2% | 8.8% | Triggered again | Meta, Tesla follow |
| Dec 2024 | 45.3% | 7.5% | After adjustment | Year-end adjustment |
Historical Comparison: Why 2023-2024 So Special?
Special Rebalancing Frequency Statistics:
- 1999-2015: Average once every 5 years
- 2016-2019: 0-1 times per year
- 2020: 0 times (pandemic caused dispersion)
- 2021-2022: Once each
- 2023-2024: 5 times total (historical record)
Root Cause: AI revolution led to tech stock polarization
- Seven Tech Giants' market cap as percentage of Nasdaq-100 total rose from 42% to 58%
- Top 10 company concentration reached historic high
- Small and mid-cap component stocks performed relatively weakly
2.3 Two Sides of Rebalancing: Insurance Mechanism Not Perfect Mechanism
Many investors hold extreme attitudes about rebalancing, either viewing it as "foolish selling too early" or as "exemplar of disciplined investing." What's the truth?
Advantage: "Safety Valve" for Systemic Risk
Hypothetical experiment of 2000 tech bubble:
If there was no rebalancing mechanism in 1999:
- Cisco market cap $450B, theoretical weight could reach 12%
- Microsoft market cap $600B, theoretical weight could reach 16%
- Intel market cap $450B, theoretical weight could reach 12%
- Top 3 combined weight: 40%
2000-2002 bubble burst:
- Cisco plunged 90% ($80→$8)
- If weight was 12%, this single stock would cause 10.8% index loss
- Actually due to rebalancing limits, loss was about 5-6%
Conclusion: Nasdaq-100 (with rebalancing) declined -83% Hypothetical without rebalancing: decline could reach -90% or more
Disadvantage: "Selling Too Early" Dilemma in Bull Markets
2023-2024 AI bull market opportunity cost:
Nvidia case:
- July 2023 reduced 1.6% weight
- Subsequently Nvidia continued rising 80%
- Opportunity cost: 1.6% × 80% = 1.28%
- 2024 reduced again
- Lost another ~0.8%
- Two-year cumulative opportunity cost: about 2.0-2.5%
Key Insight: Time Horizon Determines Advantage/Disadvantage
| Holding Period | Rebalancing Impact | Core Reason |
|---|---|---|
| Within 1 year | Negative | Opportunity cost > risk control |
| 1-3 years | Neutral | Depends on market environment |
| 3-5 years | Positive | Experience complete bull/bear cycle |
| 10+ years | Significantly positive | Risk control value fully demonstrated |
27-year data validation (1999-2025):
- Nasdaq-100 (with rebalancing): 11.16% annualized return
- Hypothetical without rebalancing (pure market-cap weighted): estimated 9.5-9.8% annualized*
- Long-term rebalancing contribution: about +1~2%/year *Based on backtesting model estimate
Uncle Haowai's Comprehensive Assessment:
"Rebalancing is like buying insurance: it seems like 'wasted money' in normal times (opportunity cost in bull markets), but it can save your life at critical moments (risk control in bear markets).
In 2023-2024, you might feel rebalancing 'sold Nvidia too early' which is regrettable, but in 2000 it helped you avoid Cisco's 90% crash, and in 2008 it helped you avoid the zero-value risk of financial stocks.
25 years of 10.81% annualized returns prove: in the long run, this 'insurance' is worth it."
III. Fee and Tax Advantages: How 0.18% Creates 45% Compounding Difference
This is the most easily overlooked yet potentially most impactful advantage.
3.1 Fee Comparison: The Compounding Lethality of 0.18% vs 2.5%
Fee Structure Comparison
| Fee Item | QQQ (Nasdaq-100 ETF) | Active Tech Funds | Difference |
|---|---|---|---|
| Management fee | 0.18%/year | 1.5-2.5%/year | 10-15x |
| Performance fee | None | 10-20% of excess returns | - |
| Trading costs | Extremely low (5-10% annual turnover) | High (150%+ annual turnover) | 15-30x |
| Sales charges | None | 1-5% front-end load | - |
| Total annual cost | ~0.20% | ~2.5-3.5% | 12-17x |
December 22, 2025 Fee Upgrade
- QQQ converted from UIT to open-end ETF
- Fee ratio reduced from 0.20% to 0.18% (10% reduction)
- Long-term impact: Can gain about 3-5% more cumulative returns over 25 years
3.2 Compounding Effect: How 2.3% Fee Difference Erodes 40% Returns
$1 Million Investment Over 27 Years Comparison
Assuming gross returns are both 11.3% (Nasdaq-100's actual annualized return + fees deducted):
QQQ (0.18% fee):
- Net annualized return: 11.12%
- After 27 years: $15,832,000
Active tech fund (2.5% fee):
- Net annualized return: 8.8%
- After 27 years: $8,740,000
Difference: $7,142,000 (45%!)
What seems like only a 2.3% annual difference results in a cumulative loss of $7.14 million over 27 years.
This still assumes the active fund can achieve the same gross returns as Nasdaq-100 (in reality, most cannot).
3.3 Tax Efficiency: The Hidden Advantage of ETF Structure
Magic of In-Kind Creation/Redemption Mechanism
Traditional mutual funds:
- Investor redeems → Fund must sell stocks for cash
- Selling stocks → Triggers capital gains tax
- Capital gains → Distributed to all holders (including non-redeemers)
- Everyone → Forced to pay taxes annually 5-10%
ETFs (like QQQ):
- Investor redeems → Exchange for physical stocks (no stock sales)
- No stock sales → No capital gains tax triggered
- Holders → Only pay tax once upon final sale
27-Year Cumulative Tax Cost Difference
Assuming investment in taxable account (non-retirement account):
QQQ:
- Hold 27 years, pay tax only once upon sale
- Assuming 20% long-term capital gains tax rate
- Actual tax burden: 20% of final gains
Active fund:
- Forced to distribute 5-10% capital gains annually
- Cumulative tax payments about 15-27 times over 27 years
- Actual tax burden: 35-45% of cumulative gains
- Tax cost difference: 15-25% return gap
Important Note:
- Retirement accounts (IRA, 401k) have no such difference, as both are tax-deferred
- Taxable account investors benefit most
- This is an "invisible cost" many people overlook
IV. Four Investment Strategy Real Test Comparison: Lump Sum vs DCA True Differences
Now, let's use 27 years of real backtesting data from 1999-2025 to see the actual performance of different strategies.
4.1 Complete Comparison of Four Strategies
Test Conditions:
- Time span: March 10, 1999 - December 31, 2025 (26.8 years)
- Total investment: Each strategy invests $1 million
- Target: Nasdaq-100 Index (via QQQ ETF)
Backtesting Results:
| Strategy | Total Invested | Final Value | Total Return | Annualized Return | Max Drawdown |
|---|---|---|---|---|---|
| Lump sum | $1M | $16.832M | 1583.26% | 11.12% | -82.96% |
| Daily DCA | $1M | $12.126M | 1114.54% | 9.78% | -52.01% |
| Weekly DCA | $1M | $12.202M | 1126.13% | 9.82% | -52.27% |
| Monthly DCA | $1M | $12.307M | 1130.96% | 9.83% | -52.75% |
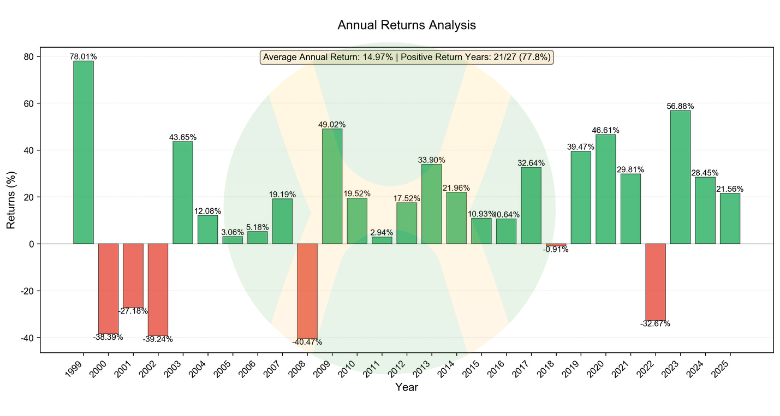
See attached chart: Analysis of annual return on a one-time investment.
Note: Daily and weekly DCA have lower total returns due to increased trading costs.
4.2 Core Finding One: Lump Sum Highest Returns, But...
Why Does Lump Sum Investment Have Highest Returns?
- Mathematical principle: Time value of compounding
- Lump sum: $1M compounds for full 27 years from day one
- Daily DCA: Invest $148 daily, later investments only compound a few years
- Difference: Lump sum earns $4.525M more than monthly DCA (36.76%)
But the cost is huge:
- Max drawdown -82.96%, meaning $1M once shrank to $170K
- Psychological tolerance: 99% of people would panic sell at -50%
- Theoretical optimal ≠ Practically feasible
4.3 Core Finding Two: DCA's True Value is "Forced Discipline"
Why Does DCA Have Much Smaller Drawdowns?
Data comparison:
- Lump sum drawdown: -82.96%
- DCA average drawdown: -52.75%
- Gap: 30.21 percentage points
Reason analysis:
Lump sum investment:
- Bought full position at bubble peak in early 1999
- 2000-2002 watched helplessly as $1M→$170K
- Extreme psychological impact
DCA strategy:
- 1999 purchases indeed at high levels
- But 2000-2002 continued buying at bottoms daily/weekly/monthly
- Average cost dramatically lowered
- 2000 purchase cost might be only 1/3 of 1999's
Case Study: During 2000-2002 Tech Bubble
Assuming monthly DCA of $3,105:
- 1999: Annual investment $37.26K, fewer shares, higher average cost
- 2000: Annual investment $37.26K, same amount buys gradually more shares, cost begins declining
- 2001: Annual investment $37.26K, same amount buys more shares, bottom-fishing cost
- 2002: Annual investment $37.26K, same amount buys more shares, lowest cost
Result: Although 1999 purchases lost 70-80%, 2000-2002 purchases all gained substantially later, overall cost averaged down
Insight: DCA is not about achieving highest returns, but about achieving returns as close to optimal as possible within the limits of human nature.
4.4 Core Finding Three: DCA Frequency Differences Are Minor
Daily vs Weekly vs Monthly Comparison:
| Comparison | Daily | Weekly | Monthly | Analysis |
|---|---|---|---|---|
| Annualized return | 9.78% | 9.82% | 9.83% | Daily has 20x more transaction costs than monthly |
| Final value | $12.126M | $12.202M | $12.307M | Gap $81K |
| Operation difficulty | High | Medium | Low | - |
| Psychological stress | High | Medium | Low | - |
Uncle Haowai's Recommendation:
"Monthly DCA is theoretically optimal, but in practice:
- Higher operation cost (though trading is now free, there are still slippage costs, but mental energy cost is significant)
- Lower psychological stress (e.g., daily operations make it easy to change plans due to market volatility)
- Small actual difference (27-year difference of $81K is only 0.7% for million-level assets)
For most people, monthly DCA is the best balance: simple operation, low psychological burden, and returns not much worse."
V. Three Major Crisis Stress Tests: True Protective Value of Rebalancing Mechanism
Enough theoretical analysis, let's look at real crises and how Nasdaq-100's rebalancing and selection mechanisms protect investors.
5.1 Drawdown Comparison of Three Major Crises
| Crisis | Time Span | Lump Sum Drawdown | DCA Average Drawdown | Difference | S&P 500 Drawdown |
|---|---|---|---|---|---|
| Tech bubble | 2000.03-2002.10 | -82.96% | -52.75% | 30.21% | -49.1% |
| Financial crisis | 2007.10-2009.03 | -49.29% | -46.81% | 2.48% | -56.8% |
| Pandemic shock | 2020.02-2020.03 | -28.56% | -28.56% | 0% | -33.9% |
Note: As DCA amounts continue growing, drawdown values gradually approach lump sum investment. If you want to continue reducing drawdowns, you must adopt portfolio allocation. This will be explained in subsequent articles.
5.2 Crisis One: 2000 Tech Bubble—Rebalancing Saved Lives
What If There Was No Rebalancing Mechanism?
Hypothetical scenario:
End of 1999 (bubble peak):
- Cisco without weight restriction could comprise 12-15%
- Microsoft could comprise 15-18%
- Intel could comprise 10-12%
- Top 3 could comprise 37-45%
2000-2002 crash:
- Cisco dropped 90% ($80→$8)
- Microsoft dropped 65% ($60→$21)
- Intel dropped 80%
- If top 3 comprised 40%+, these three alone would cause 30%+ loss
Actual result (with rebalancing):
- Nasdaq-100 decline: -82.96%
- Hypothetical without rebalancing: decline could reach -90% or more
- Rebalancing help: Reduced about 7-10% additional loss
Super Power of DCA
Data comparison:
- Lump sum investment: Full position early 1999, drawdown -82.96%
- DCA strategy: Continued buying at bottoms 2000-2002, drawdown only -52.75%
- 30.21% gap determined who could persist and who would panic sell
Mental accounting:
Lump sum investor:
- 1999: Account $1M
- End 2002: Account remaining $170K
- Mindset: "Lost $830K, wiped out"
- Behavior: High probability panic sell
DCA investor:
- 1999-2002 cumulative investment: About $155K
- End 2002 account: About $70K
- Mindset: "Also lost, but not so exaggerated"
- 2000-2002 purchases at extremely low cost
- Behavior: Easier to persist holding
5.3 Crisis Two: 2008 Financial Crisis—Power of Selection Mechanism
Nasdaq-100 vs S&P 500 Differences
| Comparison | Nasdaq-100 | S&P 500 | Nasdaq Advantage |
|---|---|---|---|
| Max drawdown | -49.29% | -56.8% | +7.5% |
| Recovery time | 2011 | 2013 | 2 years faster |
| Financial stock % | 0% (rule excluded) | ~20% | Avoided minefield |
Core Difference: Protection of Selection Rules
Nasdaq-100 advantages:
- Completely excluded financial stocks: Avoided Lehman Brothers (zero), AIG (99% crash), Citibank (-95%)
- Tech stocks more resilient: Though also declined, less than financial stocks
- Faster rebound: 2009-2011 tech stocks rebounded first
If Nasdaq-100 included 20% financial stocks then (like S&P 500):
- Financial stocks average decline about -80%
- Would drag index down additional ~16% (20% × 80%)
- Actual drawdown might reach -65% not -49.29%
Insight: Sometimes, what you don't invest in is more important than what you do. Nasdaq-100's rule excluding financial stocks saved countless investors in 2008.
5.4 Crisis Three: 2020 Pandemic—Structural Advantage of Tech Stocks
Fastest V-Shaped Recovery
Timeline:
- February 19, 2020: Nasdaq-100 hit all-time high
- March 23, 2020: Plunged -28.56%, only 33 days
- June 8, 2020: Fully recovered, only 77 days
- Full year 2020: Rose 48%, far exceeding S&P 500's 18%
Why Rebound So Fast?
Nasdaq-100's component stocks were exactly pandemic beneficiaries: • Remote work: Zoom (+400%), Microsoft Teams
- E-commerce logistics: Amazon (+76%)
- Cloud computing: Microsoft (+43%), Amazon AWS, Google Cloud
- Streaming: Netflix (+67%)
- Chip demand: Nvidia (+122%), AMD (+100%)
Compared to S&P 500:
- Contained many traditional industries (airlines, hotels, retail)
- These industries severely hit during pandemic
- Dragged down overall performance
DCA Strategy Performance
Interesting finding: 2020 pandemic shock, lump sum and DCA drawdowns exactly the same (-28.56%)
Reason:
- Pandemic dropped fast (33 days), rebounded fast too (77 days)
- DCA couldn't average down costs much in such short time
- But long-term DCA investors already accumulated large low-cost positions by end 2019
- So psychological resilience much stronger than lump sum investors
5.5 Comprehensive Conclusion: Crises Are the Only Standard for Testing Mechanisms
Statistical Analysis of Three Crises:
| Dimension | Data | Conclusion |
|---|---|---|
| Rebalancing value | 2000 reduced 7-10% additional loss | ✅ Effective at critical moments |
| Selection rules | 2008 declined 7.5% less than S&P 500 | ✅ Excluding financials saved lives |
| Industry structure | 2020 outperformed S&P 500 by 30% | ✅ Tech attribute advantage |
| DCA power | Average 30%+ drawdown reduction | ✅ Psychological moat |
Uncle Haowai's Insight:
"You ask me if Nasdaq-100's mechanisms are worth it? Look at crises:
2000: Rebalancing helped you decline 7-10% less 2008: Selection rules helped you decline 7.5% less 2020: Industry structure let you earn 30% more
Over 27 years, these 'small advantages' accumulated into the grand result of $15.83M.
While those investors pursuing 'perfect strategies' often got knocked out in the first crisis."
VI. Nasdaq-100 vs Active Funds: Why Beat 90%?
Now let's answer the core question: Why can the Nasdaq-100 "passive index" beat 90% of "active intelligence"?
6.1 Long-Term Return Comparison: Data Doesn't Lie
15-Year Rolling Returns Comparison (2009-2024)
| Asset | Annualized Return | 15-Year Cumulative | Fee Ratio |
|---|---|---|---|
| Nasdaq-100 | 17.2% | 950% | 0.18% |
| Active tech funds (average) | 12.1% | 520% | 2.3% |
| Active tech funds (median) | 10.5% | 390% | 2.5% |
| S&P 500 | 15.3% | 680% | 0.03% |
Morningstar Authoritative Statistics (1999-2024, 25 years):
- 92% of actively managed tech funds underperformed Nasdaq-100
- Funds able to sustainably outperform over 25 years: Less than 3%
- Even if outperforming short-term, most eventually regress to mediocrity
6.2 Why Can't Active Funds Win? Five Fatal Flaws
Fatal Flaw One: Fee Erosion (Already Proven)
- Combined fee difference about 2.3%/year
- 25-year cumulative erosion of 40-50% returns
Fatal Flaw Two: Market Timing Failure
Typical active fund manager behaviors:
- 2000 tech bubble: Chased highs, stepped on Cisco and Yahoo landmines
- 2008 financial crisis: Panic reduction, missed 2009 rebound
- 2020 pandemic: March panic sell, June chase highs
- 2023 AI boom: Hesitated, missed Nvidia's best entry point
Nasdaq-100:
- Mechanically executes rules, unaffected by emotions
- Automatically included Tesla, Nvidia and other mega winners
- Automatically removed Yahoo, eBay and other declining stocks
Fatal Flaw Three: Stock Selection Mistakes
Historical cases:
- 2010s most tech funds heavily weighted BlackBerry, Nokia → went to zero
- Pre-2015 underweighted Amazon (PE 500x "too expensive" then) → missed 10x
- 2019 underweighted Tesla (poor fundamentals) → missed 15x
- 2023 doubted Nvidia (PE 100x "bubble") → missed 3x
Nasdaq-100's advantage:
- Doesn't look at PE, only at market cap ranking
- Amazon PE 500x? Doesn't matter, large market cap means inclusion
- Tesla losing money? Doesn't matter, sufficient market cap means retention
- Result: Automatically captures all mega winners
Fatal Flaw Four: Scale Dilemma
Active fund paradox:
Small-scale funds:
- Flexible, can heavily weight small-cap growth stocks
- But lack brand, hard to raise capital
Large-scale funds ($5B+):
- Have brand, sufficient capital
- But constrained by liquidity, can only buy large-caps
- Actually becomes "pseudo-active"
- Yet fees still 2%+
Nasdaq-100:
- Clear positioning: 100 largest non-financial companies
- Sufficient liquidity, not constrained by scale
- Fee only 0.18%
Fatal Flaw Five: Survivorship Bias
Brutal truth:
- Over past 25 years, 60% of active tech funds already closed or merged
- The "star funds" you see are only survivors
- Those failed funds' data was erased
Nasdaq-100:
- Continuously operated 27 years, publicly transparent
- All historical data verifiable
- No "cheating" space
6.3 Why Do People Still Buy Active Funds?
Three Common Justifications' Fallacies:
Justification One: "Active funds can hedge in bear markets"
Data refutation:
- 2000 tech bubble: Active tech funds averaged -72%, Nasdaq-100 -83% (funds only declined 11% less)
- But 1999 fund managers mostly added positions at highs, investor actual losses greater
- 2008 financial crisis: Active tech funds averaged -53%, Nasdaq-100 -49% (funds actually declined 4% more)
Justification Two: "Fund managers can pick the next Apple"
Data refutation:
- 2010s top 10 winners (Apple, Amazon, Google, Facebook, Netflix, Tesla, Nvidia, Microsoft, Adobe, Salesforce)
- All 10 stocks are Nasdaq-100 components
- Most active fund managers didn't buy when these stocks were small-caps, then too scared to chase when they rose
- Nasdaq-100: As long as market cap is large enough, automatically includes, none missed
Justification Three: "Fund managers can judge market trends"
Data refutation:
- Research shows: 75% of fund managers cannot consistently time correctly
- March 2020 pandemic crash: 60% of active funds reduced positions
- Result: Missed the fastest V-shaped recovery in history
- Nasdaq-100: Rebalances by rules, automatically "adds positions" at lows
6.4 When Can Active Funds Outperform?
Only Exception: Specific Phase Small-Cap Growth Strategy
If a fund satisfies:
- Focuses on small-caps (market cap <$10B)
- Fund size <$1B (maintains flexibility)
- Fund manager has mature stock selection system
- Fee ratio <1%
Then, in early bull markets (like 2009-2013), such funds might outperform Nasdaq-100.
But the problem is:
- Such funds extremely rare (less than 5%)
- Retail investors hard to identify in advance
- Once fund grows large, advantage disappears
For most investors: Nasdaq-100 is the safer choice
VII. Three Major Limitations of Holding Nasdaq-100 Alone: Why Asset Allocation Is Needed?
The Nasdaq-100 proved itself with 27 years and $15.83M returns, but this doesn't mean you should hold it 100%.
7.1 Limitation One: Tech Stock Concentration Too High (65%)
Sector Distribution (End of 2024):
- Information Technology: 43%
- Communication Services: 15%
- Consumer Discretionary: 12%
- Healthcare: 6%
- Others: 24%
- Tech stocks combined: About 65%
Risk:
- 2022 tech stock overall correction: Nasdaq-100 fell -33%
- Same period S&P 500 fell -18% (tech stocks only 30% weight)
- If your portfolio is 100% QQQ, you bear excessive concentration risk
Hypothetical scenario:
If your 2022 asset allocation was:
- 100% QQQ: From $1M→$670K (-33%)
- 60% QQQ + 40% SPY: From $1M→$750K (-25%)
- Gap: 8 percentage points, huge psychological impact
Insight: Even though Nasdaq-100 performs excellently long-term, short-term high volatility might make you unable to hold.
7.2 Limitation Two: Lack of Hedging Tools (No Safe-Haven Assets)
Maximum Drawdown Comparison:
| Asset | 27-Year Max Drawdown | Occurrence Time |
|---|---|---|
| Nasdaq-100 | -82.96% | 2000-2002 |
| S&P 500 | -52.99% | 2008 |
| Gold | -45.55% | 2011-2015 |
| 60/30/10 portfolio* | -47.41% | 2000-2002 |
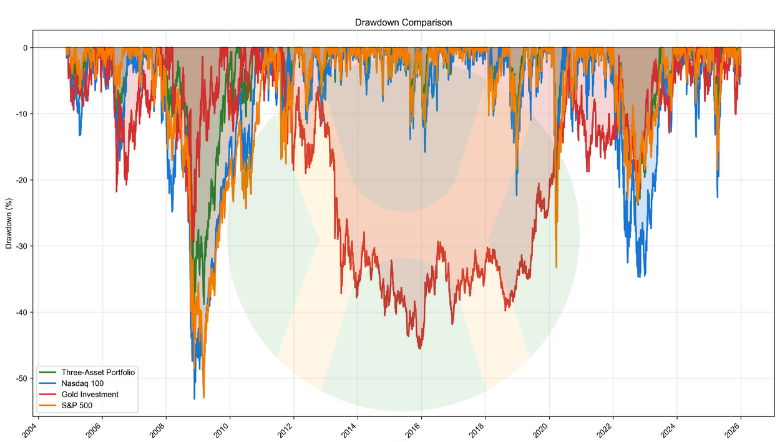
*Simple hedge portfolio using data from 2004-11-10 to 2025-12-31: 60% Nasdaq-100 + 30% S&P 500 + 10% Gold. In the next article we'll explore this portfolio optimization, which will reduce max drawdown by another 7%.
Problem: Holding Nasdaq-100 alone, "nowhere to escape" in bear markets
- 2000-2002, could only helplessly watch account shrink from $1M to $170K
- No hedging tools to buffer
- Extreme psychological pressure, hard to persist
If had allocation:
During 2000 tech bubble:
- Nasdaq-100: -83%
- S&P 500: -52.99% (relatively resilient)
- Gold: +12% (safe-haven asset)
60/30/10 portfolio drawdown:
- 60% × (-83%) + 30% × (-49%) + 10% × (+12%) = -49.8% -14.7% +1.2% = -63.3%
- Compared to Nasdaq-100 alone, reduced about 20% drawdown
Though portfolio long-term returns will be lower than pure Nasdaq-100, being able to sleep at night allows long-term holding.
7.3 Limitation Three: Volatility Too High (27% Annualized)
Volatility Comparison (1999-2025):
| Asset/Portfolio | Annualized Return | Annualized Volatility | Sharpe Ratio |
|---|---|---|---|
| Nasdaq-100 | 11.12% | 27% | 0.30 |
| S&P 500 | 10.65% | 19.14% | 0.4 |
| 60/40 portfolio (Nasdaq/S&P) | 11.32% | 22.89% | 0.36 |
| Three-asset portfolio* | 14.88% | 18.21% | 0.65 |
*60% Nasdaq-100 + 30% S&P 500 + 10% Gold (three-asset portfolio using data from 2004-11-10 to 2025-12-31)
Insight:
- Nasdaq-100 annualized volatility 25% means 68% probability annual return between -14% to +36%
- Three-asset portfolio volatility 15% means 68% probability annual return between -5.5% to +24.5%
- Reducing volatility, reducing psychological pressure, easier to persist long-term investing
7.4 Natural Lead-in: Necessity of Three-Asset Portfolio
Based on the above three major limitations, a natural question emerges:
How to retain Nasdaq-100 advantages while reducing risk and volatility?
The answer is: Three-asset portfolio allocation
"The Nasdaq-100 proved the value of 'offense' with 27 years and $15.83M returns, but -82.96% max drawdown also proved the risk of holding it alone.
Investing isn't a sprint, but a marathon. Those who reach the finish line aren't necessarily the fastest runners, but those who can endure all pain along the way.
This is why, even though Nasdaq-100 is so excellent, we still need asset allocation.
In Uncle Haowai's next article 'The Philosophy of Three-Asset Portfolio: The Golden Triangle of Offense and Defense,' I will analyze in detail for you:
- How QQQ + SPY + Gold ETF form complementarity (correlation coefficient analysis)
- Through scientific asset allocation and 9 optimization algorithm validations, provide optimal allocation ratios
- Portfolio-level rebalancing trigger mechanisms
- How to dynamically adjust ratios in bull and bear markets
- Tax-optimized rebalancing operational techniques"
Conclusion
The underlying logic of the Nasdaq-100, ultimately, is the synergistic effect of five major mechanisms:
- Selection mechanism: Dynamic optimization, automatically eliminates weak, includes strong
- Rebalancing mechanism: "Insurance" for risk control, though costly but saves lives at critical moments
- Fee advantage: 0.18% annual fee ratio, saves 40% costs over 25 years
- Tax efficiency: ETF structure, huge benefit for taxable account investors
- Discipline: Mechanically executes, defeats human weaknesses
These five mechanisms together created the miracle of $15.83M over 27 years, 11.12% annualized returns, beating 90% of active funds.
But this doesn't mean Nasdaq-100 is "perfect":
- High concentration (tech stocks 65%)
- High volatility (25% annualized)
- Max drawdown -83%
These limitations tell us: Even excellent assets need proper allocation.
As an investor, what you need to do is:
- Understand mechanisms: Know why Nasdaq-100 can outperform
- Accept limitations: Recognize there's no perfect investment
- Proper allocation: Build suitable portfolio based on your risk tolerance
- Long-term holding: Persist 27 years, not chasing short-term volatility
I'm Uncle Haowai, focusing on interpreting investment wisdom with data and logic. Hope this in-depth analysis helps you better understand the Nasdaq-100 and make wiser investment decisions.
Next Episode Preview: "The Golden Triangle of Three-Asset Portfolio"
If you have any questions or thoughts about this article, feel free to reach out. Let's continuously improve together on the ETF investment journey!